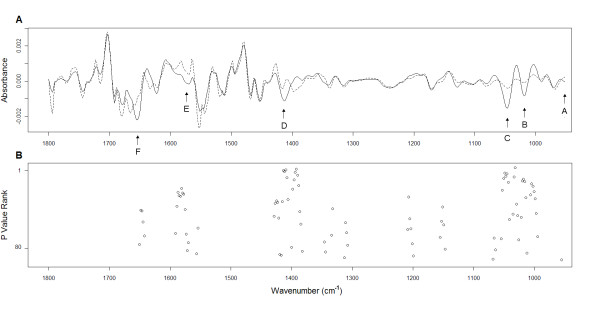
Figure 2.
Median second derivative spectra and significant wavenumbers. (A) Median second derivative spectra for cancer and normal sputum. Six major significant peaks are identified (A-F) as described in Table 1. (B) Positions of 92 peaks statistically significant between cancer and normal spectra. Each peak is ranked according to p-value where the lowest p-value attained the highest rank of 1.

