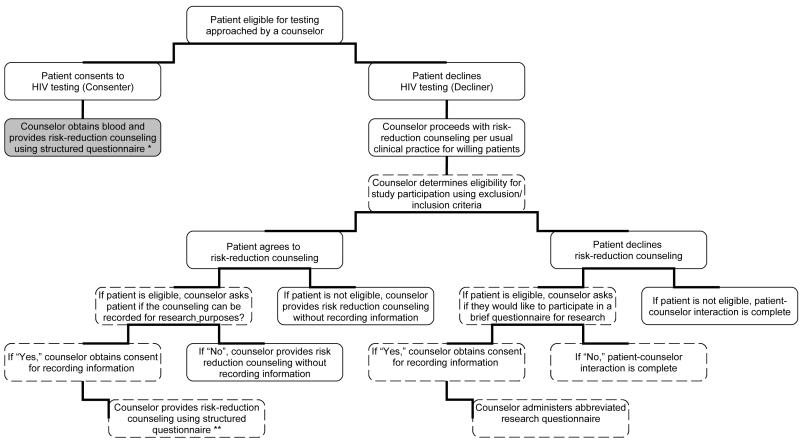
Figure 1. Screening and Enrollment Flow Chart.
Steps in patient screening and study enrollment are as shown. The shaded area represents the clinical arms for which research data were obtained from the clinical encounter, while dashed boxes represent the research arms for which data were obtained solely for the purposes of the research. * = “Consenters” in our study ** = “Decliners” in our study

