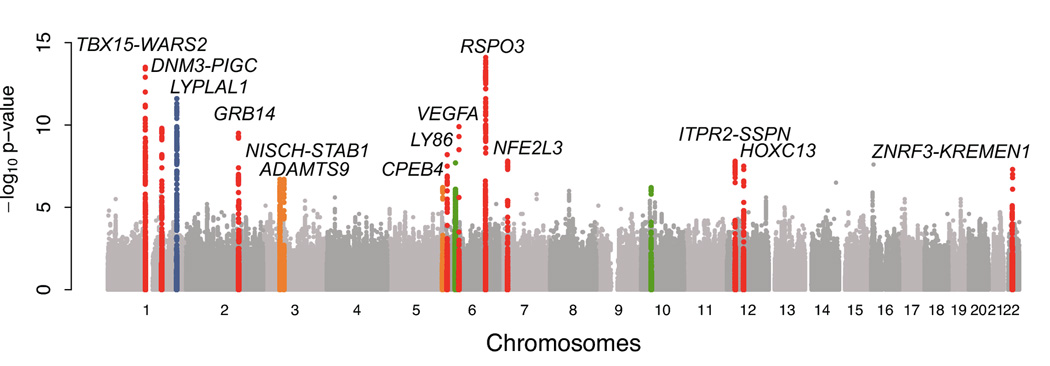
Figure 1. Genome-wide association analyses for WHR in discovery studies.
A. Manhattan plot shows results of the WHR association meta-analysis in discovery studies (P on the y-axis and SNP genomic position on the x-axis). Colored genomic loci indicate significant association (P < 5 × 10⁻⁸) detected previously (blue)13, in our GWA stage (red), and after the meta-analysis combining GWA and follow-up studies (orange). Two loci tested in the follow-up stage did not achieve genome-wide significance (green).
B. Quantile-quantile (QQ) plot of SNPs for the discovery meta-analysis of WHR (black) and after removing SNPs within 1 Mb of either the recently reported LYPLAL1 signal (blue) or the 14 significant associations (green). The grey area represents the 95% confidence interval around the test statistic under the null distribution.

