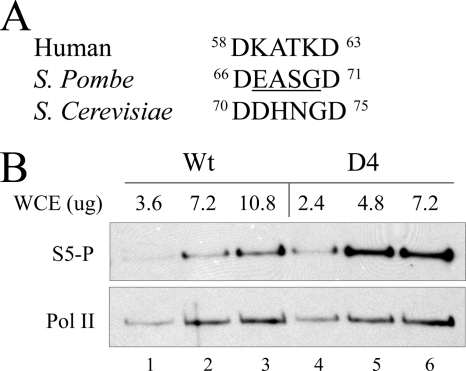
FIGURE 4.
CTD phosphorylation in vivo. A, sequence alignment of human, S. pombe, and S. cerevisiae TFIIB finger motif is shown. B, extracts of S. pombe transformed with either the wild type or D4 form of TFIIB were assayed by Western blots using antibodies against ser-5P (top) or RNA polymerase (bottom). The amount of extract used is shown. Two independent experiments were averaged, showing that the D4 signal was 3-fold greater than wild type. WCE, whole cell extract; Pol II, RNA polymerase II.

