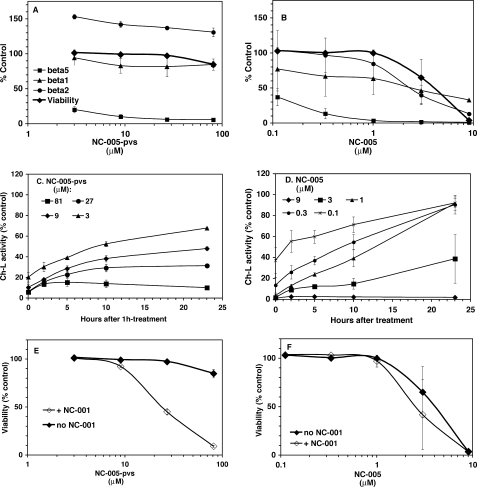
FIGURE 4.
Effect of 1-h pulse treatment HeLa S3 cells with NC-005-pvs (A, C and E) and NC-005 (B, D and F). HeLa S3 were treated with inhibitors for 1 h and then cultured in the absence of inhibitor for 48 h, whereupon cell viability was measured with an Alamar Blue assay. At times indicated, proteasome peptidase activities were measured in the aliquots of cultures. A and B, Proteasomal peptidase activities immediately after 1 h of treatment plotted together with cell viability 48 h after start of the experiment. Squares, β5 activity; triangles, β1 activity; circles, β2 activity; diamonds, cell viability. C and D, activity of β5 sites was measured at different times after removal of inhibitor. Activity is normalized to the number of cells per sample. Numbers in the legend indicate concentration of the inhibitors used for treatments. See Fig. S3 for β1 and β2 activity values. E and F, following NC-005-pvs and NC-005 treatment, cultures were split in half. One set of cultures was continuously treated with 4 μm NC-001 (open diamonds), the other mock treated (closed diamonds). NC-001 completely inhibited β1 activity but did not inhibit β2 activity and did not alter recovery rate of β5 activity (supplemental Fig. S3). On all graphs, values are average ± S.E. of 2 or 3 independent measurements (i.e. biologic replicates).

