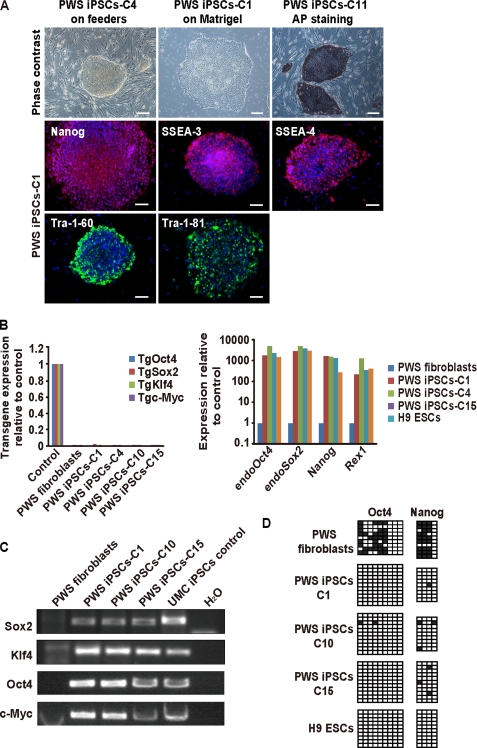
FIGURE 1.
Generation of iPSCs from a patient with PWS. A, upper panels, phase-contrast photographs of representative PWS iPSC clones (C4 P21 and C1 P24, where P indicates passage) grown on feeder layers or Matrigel; alkaline phosphatase (AP) staining of another clone (P17) grown on feeders is also included. Scale bars = 200 μm. Middle and lower panels, immunofluorescence microscopy photographs for the indicated ESC markers of a representative PWS iPSC clone (P22). Nuclei are stained in blue with DAPI. Scale bars = 50 μm. B, left panel, qPCR for the transgenes (Tg) in the indicated PWS iPSC clones. Values refer to transduced donor PWS fibroblasts extracted at day 6; untransduced fibroblasts were included as a control. Right panel, qPCR for selected endogenous ESC transcription factors in representative PWS iPSC clones (C1 P11, C4 P10, and C15 P9). Values refer to donor fibroblasts; H9 ESCs (P36) were used as a positive control. C, semiquantitative PCR shows integration of SOX2, KLF4, OCT4, and c-MYC transgenes in the genomic DNA of three representative PWS iPSC clones. Donor PWS fibroblasts, a previously reported iPSC clone from UMCs, and water were used as controls. D, DNA methylation profile of the proximal OCT4 and NANOG promoters analyzed by bisulfite sequencing. Donor PWS fibroblasts, H9 ESCs (P36), and representative PWS iPSC clones (C1 P11, C10 P10, and C15 P9) were included. Filled squares indicate Cs that failed to be converted to T in the context of CpGs as a result of being methylated; empty squares indicate unmethylated (C-T converted) CpGs.

