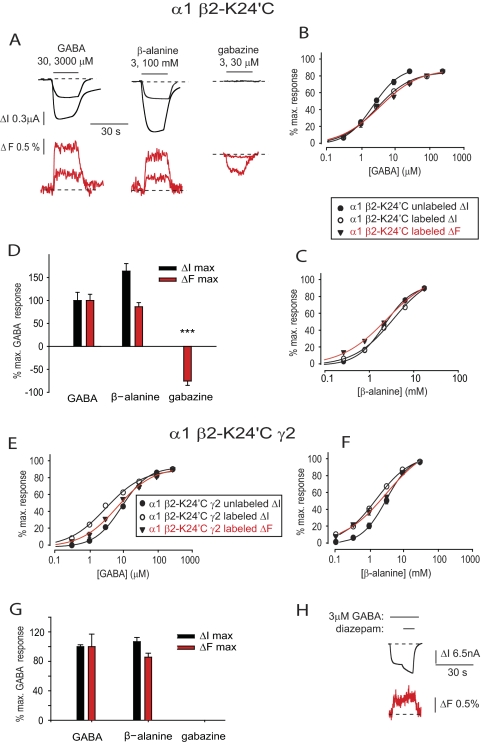
FIGURE 6.
Current and fluorescence responses recorded from GABAARs incorporating MTS-R-labeled β2-K24′C subunits. A, current and fluorescence traces recorded from α1 β2-K24′C GABAARs in response to the indicated concentrations of GABA, β-alanine, and gabazine. B and C, averaged concentration-response relationships for GABA (B) and β-alanine (C) at the α1 β2-K24′C GABAAR. D, comparison of ΔImax (black) and ΔFmax (red) responses for GABA, β-alanine, and gabazine at the α1 β2-K24′C GABAAR. Data are normalized to mean GABA values. ***, p < 0.001 by unpaired t test. E and F, averaged concentration-response relationships for GABA (E) and β-alanine (F) at the α1 β2-K24′C γ2 GABAAR. G, comparison of ΔImax (black) and ΔFmax (red) responses for GABA, β-alanine, and gabazine at the α1 β2-K24′C γ2 GABAAR. Data are normalized to mean GABA values. Note the lack of response to gabazine. H, current and fluorescence traces recorded from α1 β2-K24′C γ2 GABAARs in response to the indicated concentrations of GABA and diazepam. Error bars, ± S.E.

