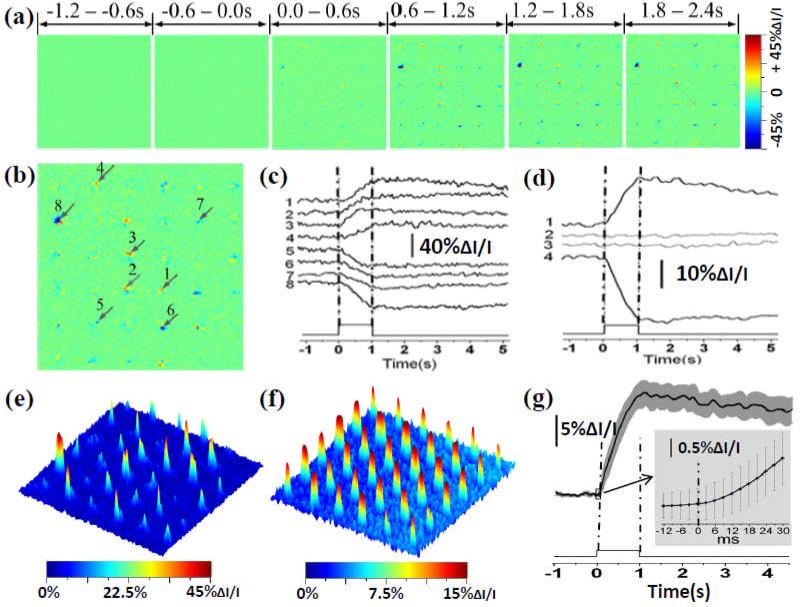
Fig.2.
(a) MLA recording of retinal activation. Each illustrated IOS image is an average over 600 ms interval (i.e., 200 frames, 3 ms/frame). (b) Enlargement of the 4th frame in (a). (c) Black traces 1-8 show IOSs of randomly selected 8 pixels pointed by the arrowheads in (b). (d) Black traces 1 and 4 show the average of all the positive and negative IOSs within the MLA spot areas. Gray traces 2 and 3 show the positive and negative IOSs without stimulus. (e) IOS magnitude map of the single-trial MLA recording shown in (b). (f) Averaged IOS magnitude map of 6 MLA recordings. (g) Temporal dynamics of overall IOS magnitude shown in (f).

