Figure 1.

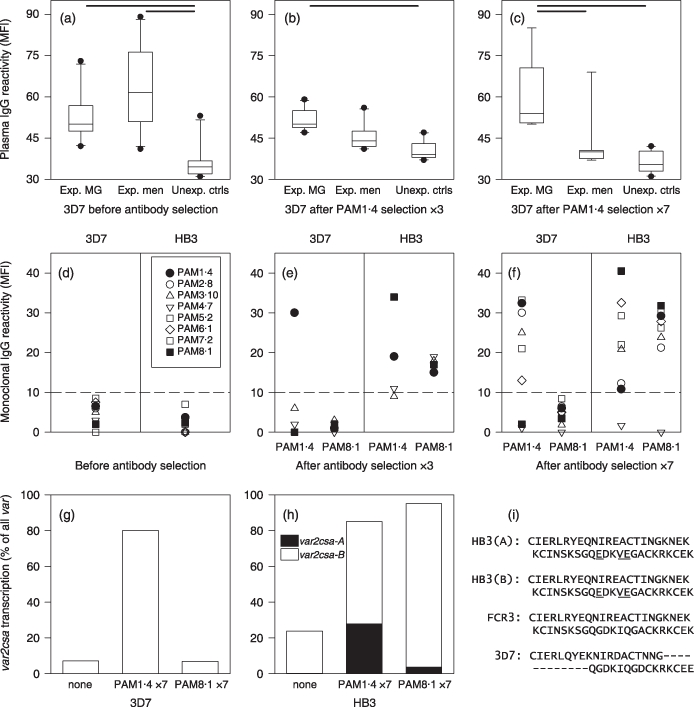
Changes in VSA expression andvar gene transcription following selection for expression of VSAPAM reactive with human monoclonal antibodies.Recognition of IEs by plasma IgG from 10 P. falciparum-exposed multigravidae (Exp. MG), 10 sympatric men (Ex. men) and 10 nonexposed controls (Unexp. ctrls) before selection (a), and after three (b) or seven (c) rounds of selection by human monoclonal IgG antibody PAM1·4. Results in panels A-C are presented as medians (horizontal line), central 50% of data points (boxes), central 80% of data points (whiskers) and outliers (•). In addition, statistically significant (P < 0·05) pair-wise differences are indicated by heavy horizontal bars along the top of the panels. Recognition of IEs by human monoclonal VSAPAM-specific IgG antibodies before selection (d), and after three (e) or seven (f) rounds of selection. Results in panels D–F are presented as individual data points. Negative cut-off, defined as the upper level of recognition of unselected parasites, is indicated as a dashed horizontal line. The proportion of var2csa transcripts among all var transcripts in 3D7 (g) and HB3 (h) before selection and after seven rounds of selection. Panel (i) shows the amino acid sequence of the PAM8·1-specific region of VAR2CSA DBL3-X in the two VAR2CSA paralogs in HB3, FCR3, and 3D7 parasites. Amino acid differences between the two HB3 sequences and the PAM8·1-reactive FCR3 sequence are underlined.
