Figure 2.
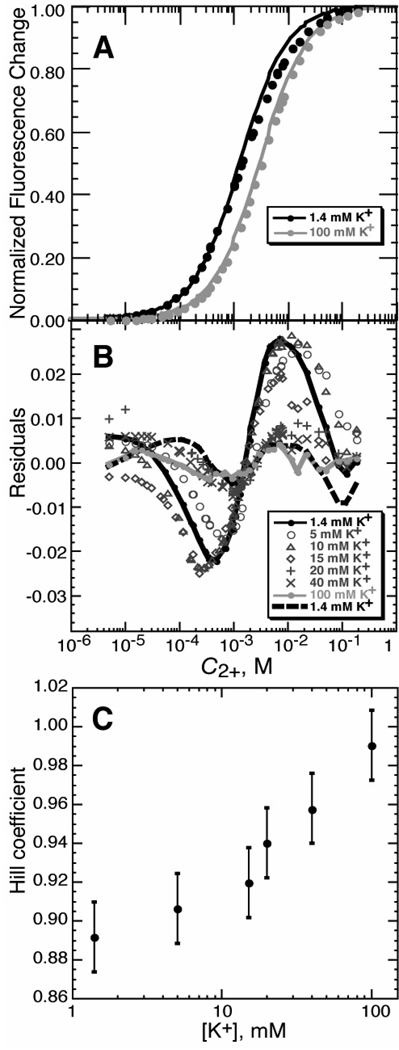
Mg2+ - HQS binding isotherms. A) Titrations of HQS with MgCl2 in either buffer alone (black symbols; 5 mM KMOPS buffer, 1.4 mM K+, pH 6.8) or the same buffer with added KCl (100 mM total K+; gray symbols). The curves are least squares best fits of a single-site binding isotherm (eq 9, with n = 1). Fluorescence intensity data were collected and normalized as described in Materials and Methods. B) Residuals of single-site binding isotherms fit to HQS titrations carried out with various concentrations of added KCl; total K+ concentrations, which include 1.4 mM contributed by the buffer, are indicated in the legend (see Materials and Methods for further details). The dashed black line indicates the residuals of a fit of eq 9 to the titration in 1.4mM K+, for which the Hill coefficient n was allowed to float; the same data fit with n = 1 are indicated with a solid black line. The gray solid line indicates the quality of fit for the single-site binding isotherm for the data collected in 100 mM K+. C) The HQS-Mg2+ titrations were fit to eq 9, treating the Hill coefficient n as a variable. n approaches 1 as the concentration of KCl increases. The K+ concentration is equal to the initial anion concentration (the sum of the chloride and MOPS anion concentrations). Error bars are from bootstrap analysis (see Materials and Methods).

