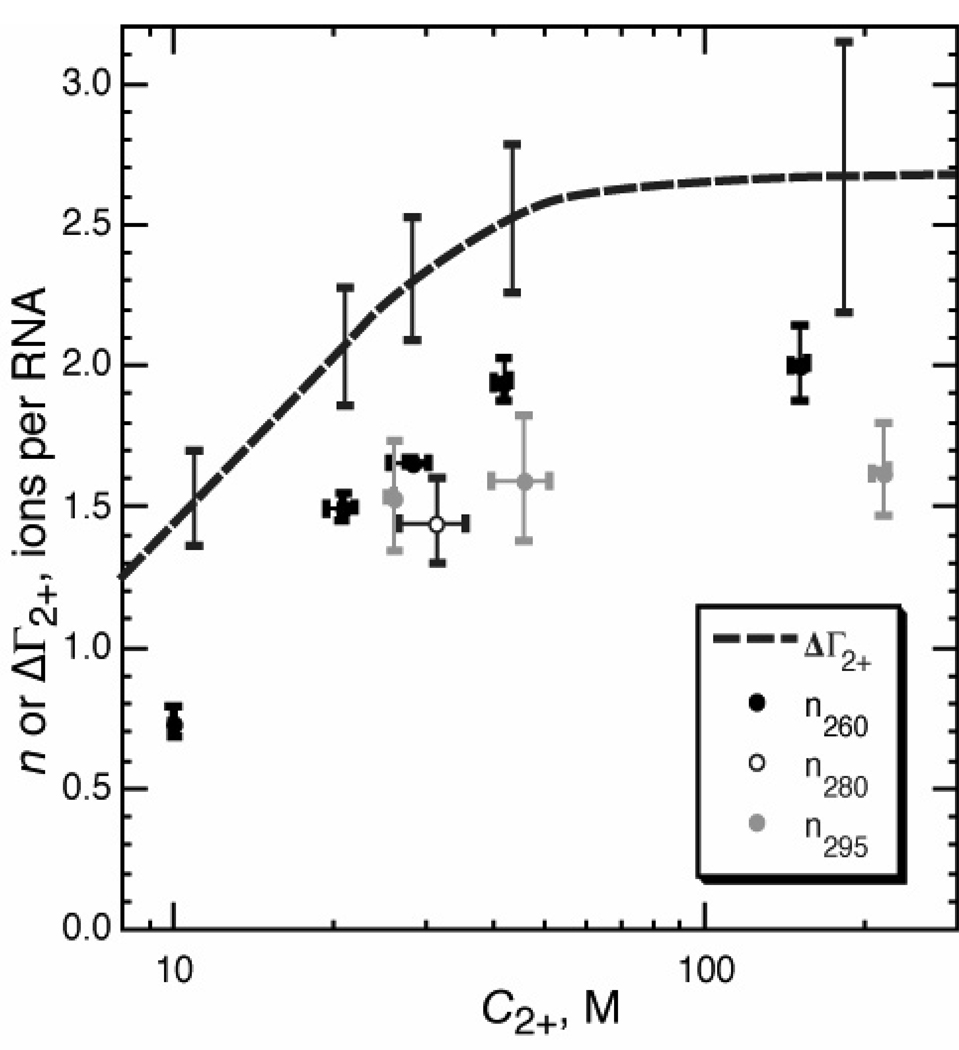
Figure 5.
Comparison of the empirical Hill coefficient n for A-riboswitch folding with a direct measurement of ΔΓ2+. (circles), plot of Hill coefficients n vs. titration midpoints (C2+) taken from Table 1. Subscripts of n refer to the wavelength at which titration data were collected. (dashed line), ΔΓ2+ calculated from measurements of Γ2+ for folded and partially unfolded RNA (Figure 6). Error bars are shown at selected C2+ for comparison with n values.

