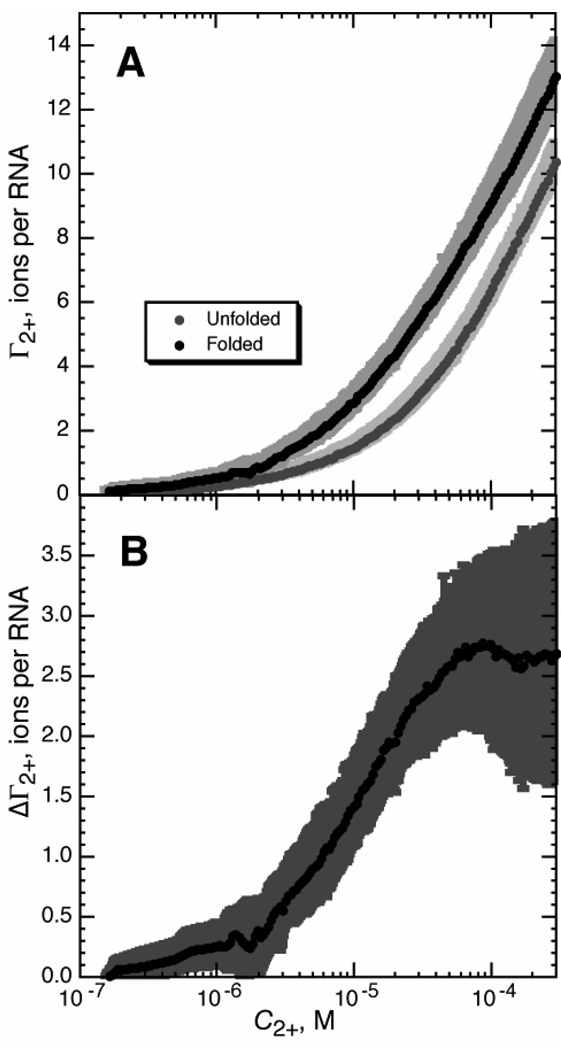
Figure 6.
Preferential interaction coefficients (Γ2+) for the A-riboswitch, as calculated from RNA-HQS titration experiments. Titrations were carried out at 20 °C in buffer containing 20 mM MOPS, pH 6.8, and 50mM K+. A) Γ2+ measured in the presence (black circles) or absence (gray circles) of 250 µM DAP. Error bars are standard deviations calculated from four interpolated data sets. B) ΔΓ2+, the difference between Γ2+ for folded and unfolded A-riboswitch RNA (panel A), as a function of Mg2+ concentration.

