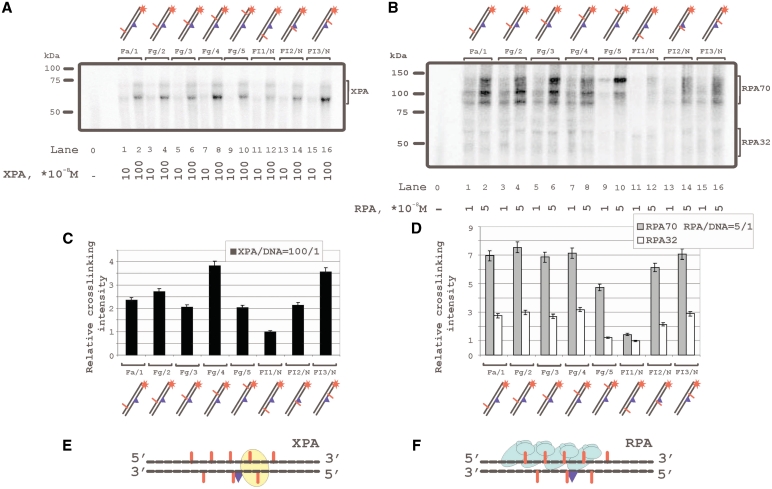
Figure 2.
Topography of the XPA and RPA protein location on damaged DNA duplex by photoaffinity labeling. The damaged DNA model substrates carry photoreactive 5I-dUMP-substitutions at the indicated positions of radioactively 5′-end labeled damaged or undamaged strands. The reaction mixtures (10 μl) contained 50 mM Tris–HCl 7.5, 100 mM KCl, 1 mM DTT, 0.6 mg/ml BSA, 10 nM 5′-32P-labeled photoreactive DNA and protein factors at analyzed concentrations: (A) 10 or 100 × 10−8 M XPA; (B) 1 or 5 × 10⁻⁸ M RPA. The photocrosslinking products were separated by SDS–PAGE and visualized by autoradiography. The (C) and (D) panels shows quantitative analysis of the data from the (A) and (B) photocrosslinking experiments. (C) Diagram of the relative intensities of the XPA photocrosslinked products. (D) diagram of the relative intensities of the RPA photocrosslinked products. Averages and experimental errors were taken from three experiments. (E) and (F) localization of XPA and RPA, respectively, on damaged DNA duplex (in accordance with photocrosslinking intensity maximums).

