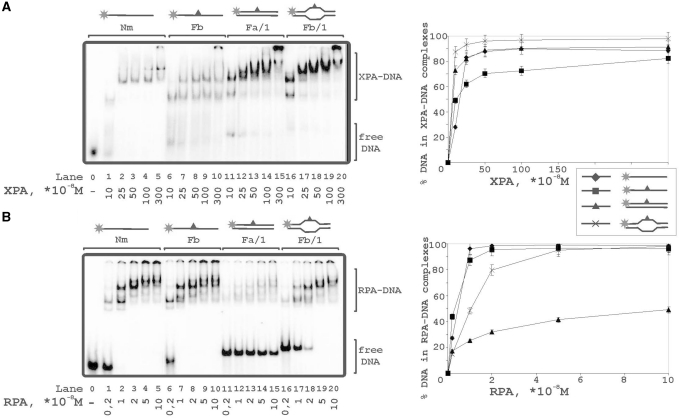
Figure 6.
Binding of XPA and RPA to various types of DNA structures. The reaction mixtures (10 μl) contained 50 mM Tris–HCl 7.5, 100 mM KCl, 1 mM DTT, 0.6 mg/ml BSA, 10 nM 5′-32P-labeled DNA structure (lanes 0–5: undamaged ssDNA; lanes 6–10: damaged ssDNA; lanes 11–15: damaged DNA duplex; lanes 16–20: damaged DNA duplex with bubble) and protein factors at analyzed concentrations: (A) 10, 25, 50, 100 or 300 × 10−8 M XPA; (B) 0.2, 1, 2, 5 or 10 × 10−8 M RPA. The right panels show quantitative analysis from the A and B experiments. Bars indicate error of five independent sets of experiments.

