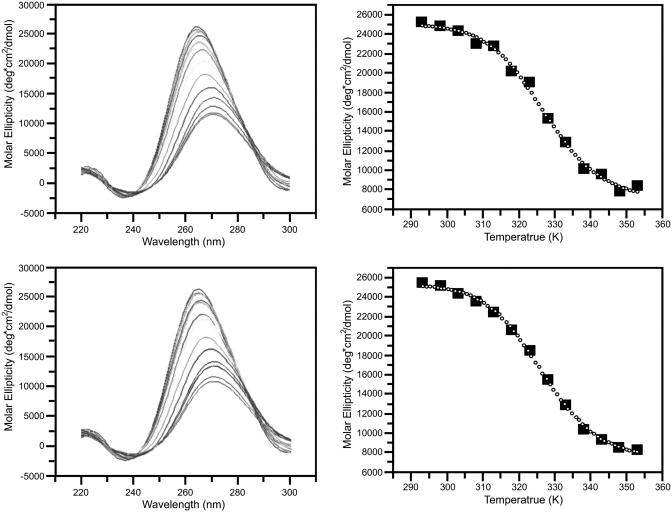
Figure 3.
CD of STMV RNA as a function of temperature. CD ellipticity profiles were collected at 5°C intervals between 20°C and 80°C. The top left panel shows the CD profile as a function of wavelength and temperature as the RNA unfolds. The darkest line represents the RNA at room temperature and the profile becomes broader and blue shifts as the temperature increases. The molar ellipticity of the unfolding process was plotted at 262 nm wavelength as a function of temperature at top right. In the lower left panel the folding process was monitored by measuring the CD ellipticity starting at 80°C. As the temperature decreased the profile progressively returns to that seen for 20°C. The molar ellipticity of the folding process is again shown, with the process initiated at high temperatures progressing towards room temperature (lower right).

