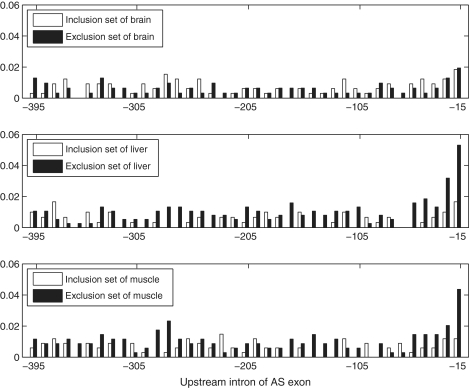
Figure 5.
position distribution comparison for the us' ISS−LM CUCUCU in upstream introns of the exclusion set and the inclusion set of brain, liver and muscle. Each bar represents the average number of SREs falling into a region of 10 nt normalized by the number of intronic sequences used in analysis.

