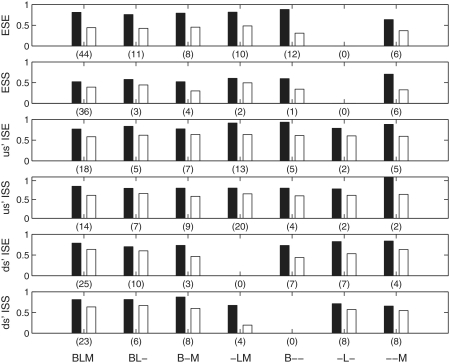
Figure 6.
Comparison of frequencies of different SREs in different data sets. The first bar in each group stands for the ratio of the frequency in constitutive data to the frequency in the positive data. The second bar stands for the ratio of frequency in the negative data to the frequency in the positive data. Number of SREs used in each comparison is shown in parenthesis.

