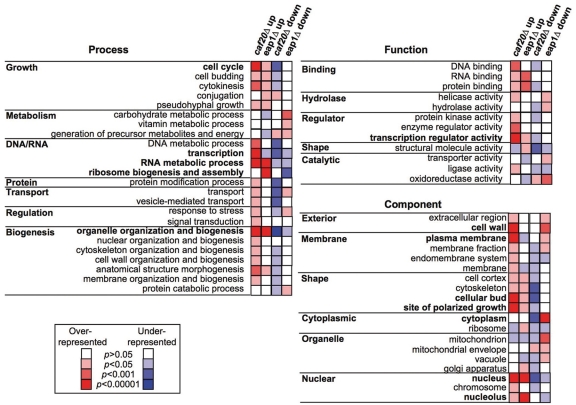
Figure 3.
Functional classification of regulated mRNAs. Yeast ‘GO Slim’ summary of significantly enriched and under-represented gene Ontology classes calculated using the hypergeometric distribution (performed at www.yeastgenome.org), see Supplementary Table S10 for more details including all calculated P-values. Bold text indicates most over-represented classes (P < 0.00001) in one or more experiment.

