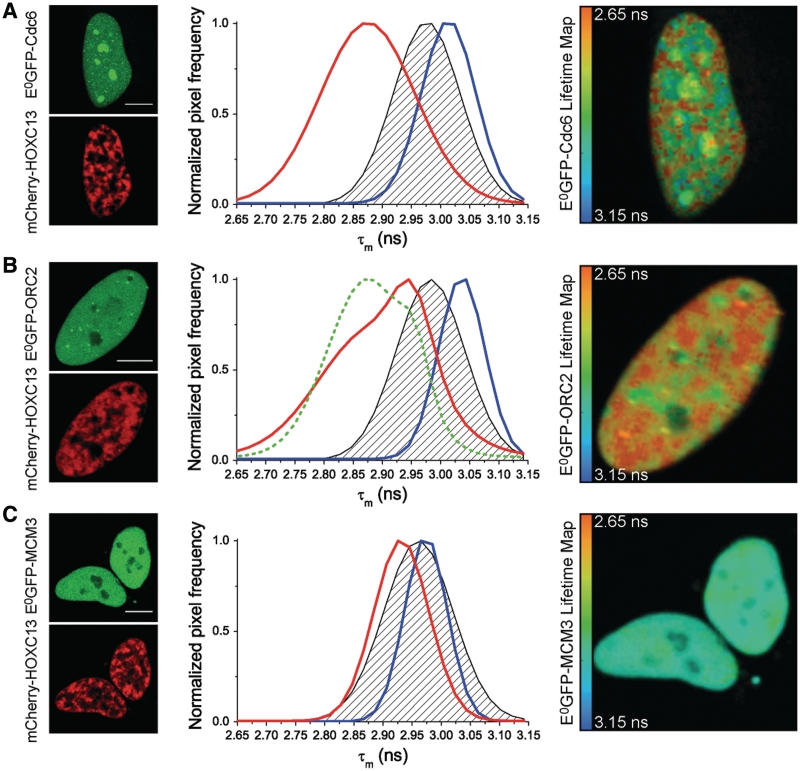
Figure 7.
FLIM analysis of mCherry-HOXC13 interactions with E0GFP-fusions of Cdc6 (A), ORC2 (B), MCM3 (C) in living cells. Left side of each panel: representative fluorescence-intensity images of the cells used in the FLIM study. Cells expressed both donor E0GFP (green top image) fused in turn to Cdc6 (A), ORC2 (B), MCM3 (C), and acceptor mCherry (red bottom image) fused to HOXC13. In the middle graphs of each panel: plot of the frequency of nuclear pixels versus the mean donor lifetime (τm) calculated for each pixel. The blue curve represents the τm distribution of cells expressing the respective E0GFP-fusion of the probed protein alone. The black dashed area represents the negative control: this was obtained either transfecting E0GFP-NLSSV40 with mCherry-HOXC13 or E0GFP-pre-RC proteins with untagged mCherry (the average of the two controls is presented here and in Table 1). The red curve shows τm distribution for cells co-expressing the respective E0GFP-fusion of the probed protein with mCherry-HOXC13. All reported curves are cumulative sum-distribution data relative to all analyzed cells (Table 1); the pixel frequency is normalized to the peak of each distribution curve. Positive in vivo interaction, is detected by FRET as a significant shift of the red curve versus lower τm values when compared to the dashed area of the negative control, this is evident for the case of Cdc6 (A) and ORC2 (B). On the right side of each panel: representative donor-lifetime maps in the presence of mCherry-HOXC13. Scale bar: 10 µm.

