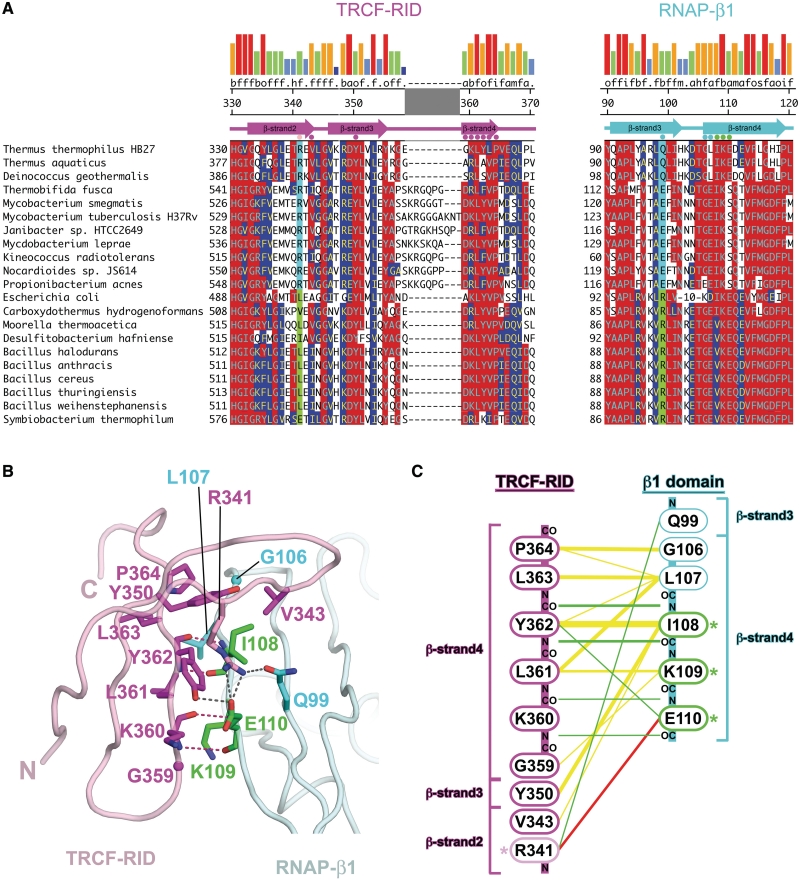
Figure 2.
Sequence and structural features of the TRCF–RID/RNAP-β1 interface. (A) Sequence conservation in the TRCF–RID/RNAP-β1 interface. Sequences are shown in one-letter amino acid code and identified by species at the left. The numbers at the beginning of each line indicate amino acid positions relative to the start of each protein sequence. Residues involved in direct interprotein contacts in the TRCF–RID/RNAP-β1 interface are denoted by colored dots directly above the sequences. The locations of β-strands are denoted schematically above the sequences. The numbers above indicate the amino acid position in Tth TRCF and RNAP-β. Positions in the alignment that share >50% identity with the consensus are indicated by red shading, while positions that share >50% homology are indicated by blue shading. Homology groups are defined as: a, acidic (DE); b, basic (HKR); f, aliphatic (AGILV); m, amide (NQ); o, aromatic (FWY), h, hydroxyl (ST); i, imino (P); s, sulfur (CM). Shown at the very top is the consensus homology, and the strength of the homology shown in a histogram (tall red bar, 100% homologous, short blue bar, <20% homologous). The positions correlated between the TRCF–RID and RNAP-β1 are highlighted in cyan/green). If the position corresponding to Tth TRCF–RIDR341 is R, then the position corresponding to Tth RNAP-β1Q99 is Q or E (cyan). On the other hand, if the TRCF–RID residue is I, L, V, or E, then the RNAP-β1 residue is R (green). (B) Molecular structure of the TRCF–RID/RNAP-β1 interface. The TRCF–RID is shown as a pale pink backbone worm. Residues involved in direct contacts with RNAP-β1 are shown in stick format (nitrogen atoms, blue; oxygen, red; carbon, magenta, except R341 is pink). The RNAP-β1 is shown as a pale cyan backbone worm. Residues involved in direct contacts with the TRCF–RID are shown in stick format (nitrogen atoms, blue; oxygen, red; carbon, cyan, except I108, K109 and E110 are green). Polar contacts are shown as dashed lines (backbone–backbone hydrogen bonds, red; side-chain polar contacts, grey). (C) Schematic diagram illustrating TRCF–RID/RNAP-β1 intermolecular contacts: yellow lines, van der Waals contacts (<4 Å); green lines, hydrogen bonds (<3.2 Å); red lines, salt bridges/hydrogen bonds. Note that the TRCF–RID is shown with the C-terminus at the top, while the RNAP-β1 is shown with the N-terminus at the top.

