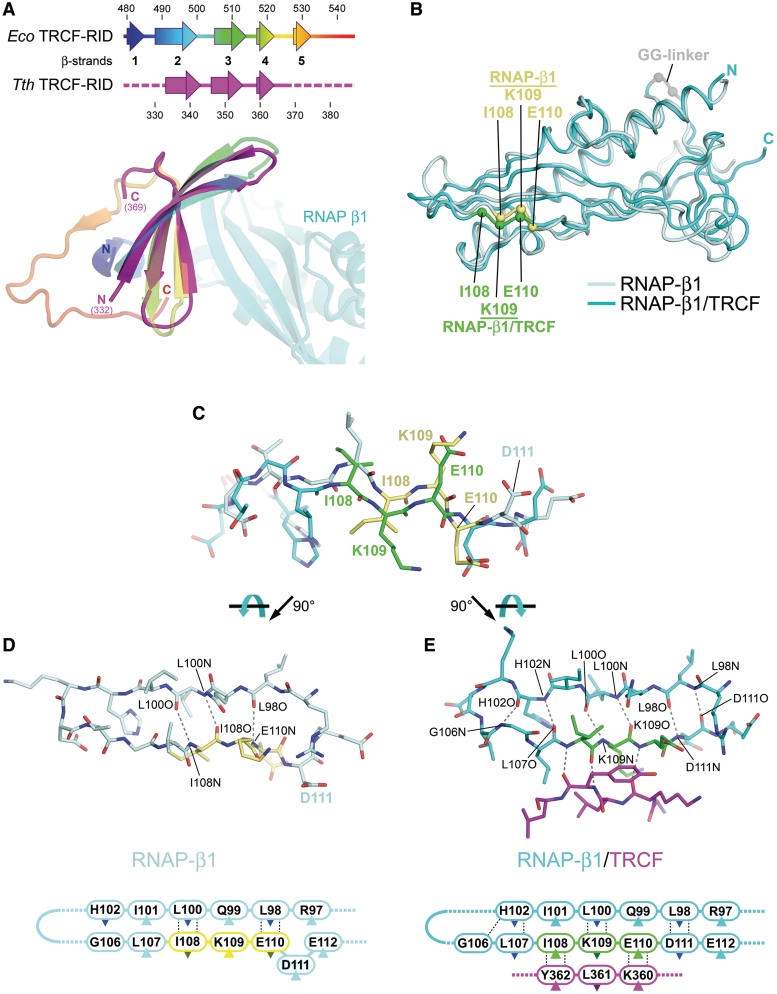
Figure 3.
Structural comparisons. (A) Comparison of the Eco TRCF–RID (residues 479–545 from the Eco TRCF structure; (8), colored as a ramp from blue (N-terminus) to red (C-terminus), and the Tth TRCF–RID (colored magenta) from the TRCF–RID/RNAP-β1 complex. The secondary structure of the two proteins is shown in schematic form on top. Below, the superimposed TRCF–RID structures are shown as ribbon diagrams, color-coded as in the schematic. The Taq RNAP-β1 complexed with Tth TRCF–RID is also shown. (B) Comparison of the Taq RNAP-β1 domains from the Taq core RNAP (pale cyan) (26), and from the TRCF–RID/RNAP-β1 complex (cyan). The superimposed structures are shown as backbone worms. The α-carbons of the TRCF–RID interface residues I108, K109, and E110 are shown as spheres (RNAP, yellow; complex with TRCF–RID, green), illustrating the register shift. (C) Side view of RNAP-β1 residues 102–112 from the RNAP structure (pale cyan, but with I108/K109/E110 colored yellow) and from the TRCF–RID/RNAP-β1 structure (cyan, but with I108/K109/E110 colored green), illustrating the register shift. The structures were aligned over the entire β1 domain. (D) Top view of RNAP-β1 β-strand 3 and β-strand 4 from the RNAP structure. Backbone-backbone hydrogen bonding interactions are shown as dashed grey lines. Below is the same, shown as a schematic. The dark-colored triangles denote side chains that point away from the viewer, down into the plane of the page. The light-colored triangles denote side chains that point up towards the viewer, out of the plane of the page. (E) Top view of RNAP-β1 β-strand 3 and β-strand 4 from the TRCF–RID/RNAP-β1 structure. Also shown are TRCF–RID360–362 (magenta). Backbone-backbone hydrogen-bonding interactions are shown as dashed grey lines. Below is the same, shown as a schematic.

