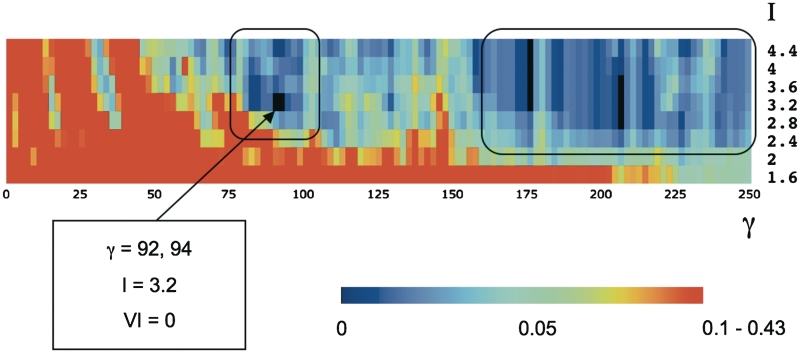
Figure 3.
Identification of robust MCL partitions for the mH178 data set based on the in vitro DNA-binding profiles. The heat plot displays the average distance of each MCL partition of the mH178 data set to its eight immediate-neighbor partitions, each obtained with one-step perturbation of the γ (±2, horizontal axis) and/or I (±0.4, vertical axis) parameters (see ‘Results’ section for details). The distance between partitions is computed using the Variation of Information (VI) metric, and follows the depicted color scale. Robust partitions (<VI> = 0) are depicted in black and the most different partitions (VI between 0.1 and 0.43), in red. Two regions showing higher than average robustness are highlighted by black rectangles: one representing non-trivial clustering solutions (including MCLb-pref at γ = 92–94, I = 3.2), and a larger region (γ > 160) representing trivial solutions consisting of a large number of singletons clusters.

