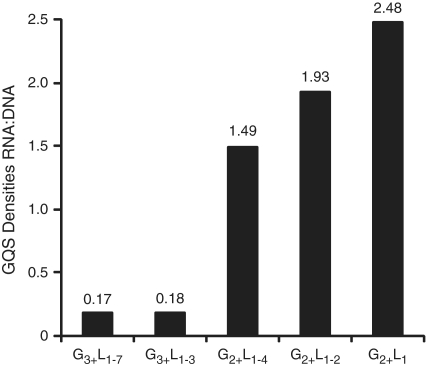
Figure 3.
Ratio of RNA GQS density to non-genic DNA GQS density for different GQS motifs. DNA GQS density includes G and C sequences in the intergenic region only (Table 2, column 3), since this will not lead to GQS in RNA. RNA GQS density includes only the G sequences found in the genic regions (Table 5, column 3). For example, G3+L1–7, RNA GQS density is 2.9 and the DNA intergenic region GQS density is 16.7, leading to a ratio of 0.17.

