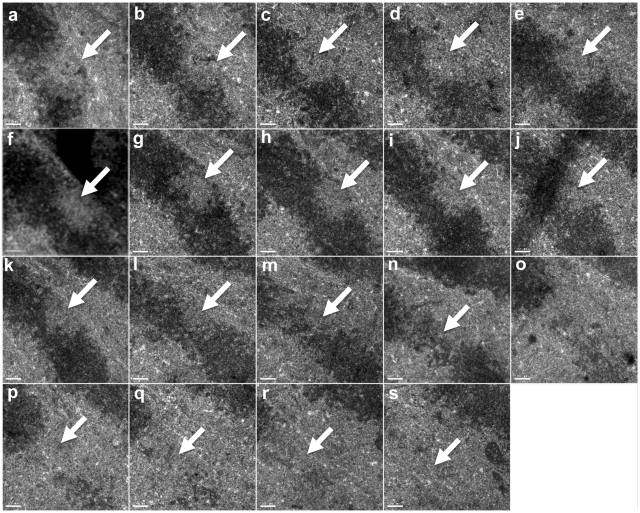
Figure 3.
Serial sections of a chromosome fixed 1–2 s post near-IR laser damage. Sections go from the area closest to the subtrate/coverslip to the top of the cell. The damaged area appears smaller in size moving from (a–n) and this reflects the laser beams Gaussian profile where the greatest amount of energy will be deposited in the focal spot.

