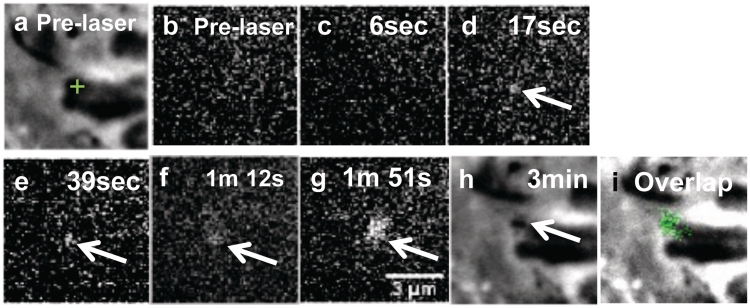
Figure 8.
Cells expressing GFP-Nbs1 show an increase in fluorescence intensity and radius at chromosomes damaged by the laser which is similar to the formation of the phase dark material. (a) Pre-laser phase image where the green cross-hair shows the area targeted by the laser. (b) Fluorescence pre-laser image. Each image is labeled with the time following laser exposure. (c) Six seconds post laser GFP-Nbs1 accumulation is still undetectable within the damaged site. (d) Seventeen s post-laser we get fluorescence. (e–g) As time progresses, fluorescence is seen to increase in intensity. (h) Final phase image taken showing the phase dark region. (i) Shows the overlap between the fluorescence and phase dark spot observed in (h).

