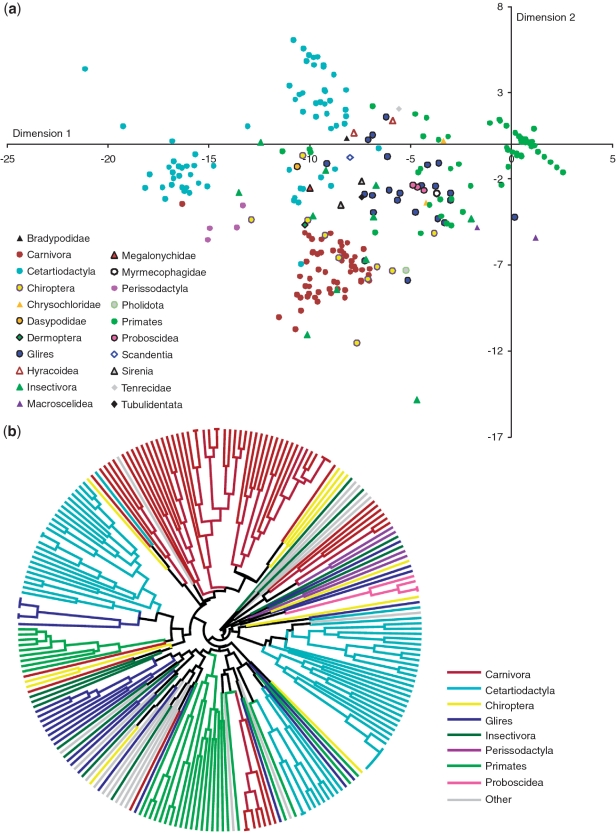
Figure 4.
Discrimination of eutherian species using standard SPInDel profiles. (a) MDS plot obtained from the matrix of pairwise distances measured by the number of different loci between profiles. Species were labeled according to their taxonomic category. (b) UPGMA polar tree representing the phylogenetic relationship among the most represented eutherian groups. The input matrix and UPGMA tree were generated by the SPInDel workbench.

