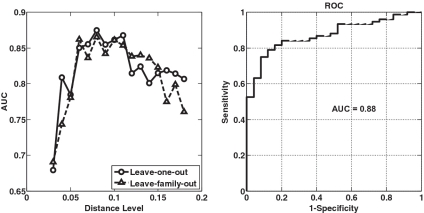
Figure 4.
Results of discriminant analysis. (left panel) The AUC curves obtained at various distance levels ranging from 0.03 to 0.18; (right panel) The ROC curve obtained at the 0.08 distance level. The sensitivity and specificity are defined as the rate of correctly predicting obese and lean individuals, respectively.

