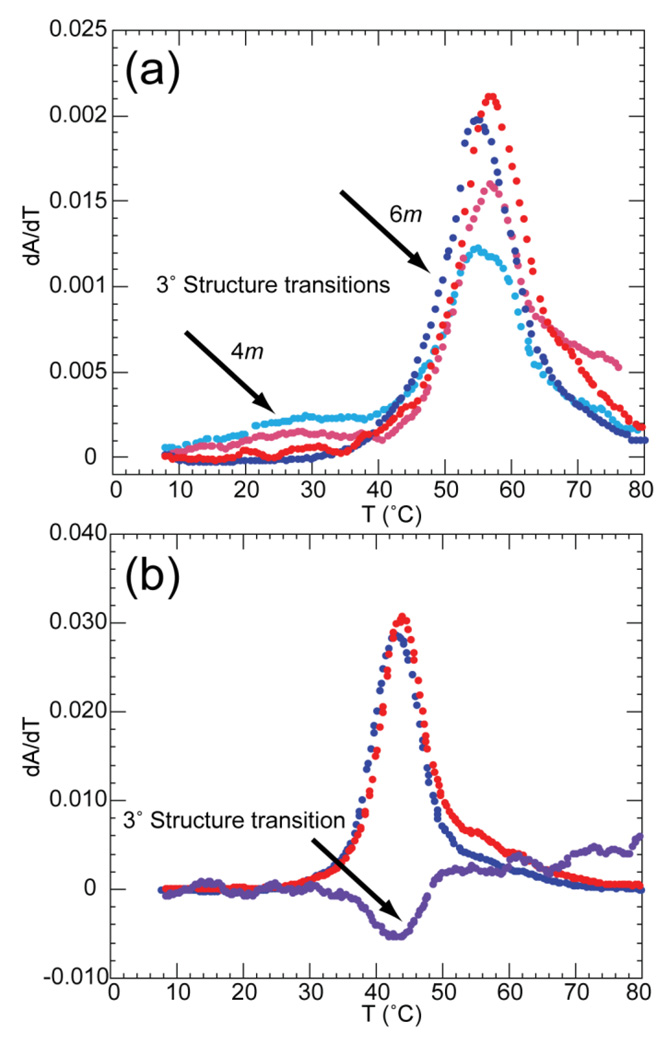
Figure 3.
Melt profiles of 58mer RNA in various TMAO and salt concentrations. A) Data sets were collected at 260 (blue) and 280 (red) nm in buffer containing 400 mm K+, 2 µm EDTA and either 100 mm K-MOPS pH 6.8 with 4 m TMAO (light shades), or 160 mm K-MOPS pH 6.8 and 6 m TMAO (dark shades). B) Data were collected at 260 (blue), 280 (red), and 295 (purple) nm in the presence of 52.4 mm K+, 2 µm EDTA, 182 mm K-MOPS and 7.7 m TMAO. Arrows indicate the change in ratio of absorbance at 260/280nm (A) or 295nm signal (B) corresponding to melting of tertiary structure.

