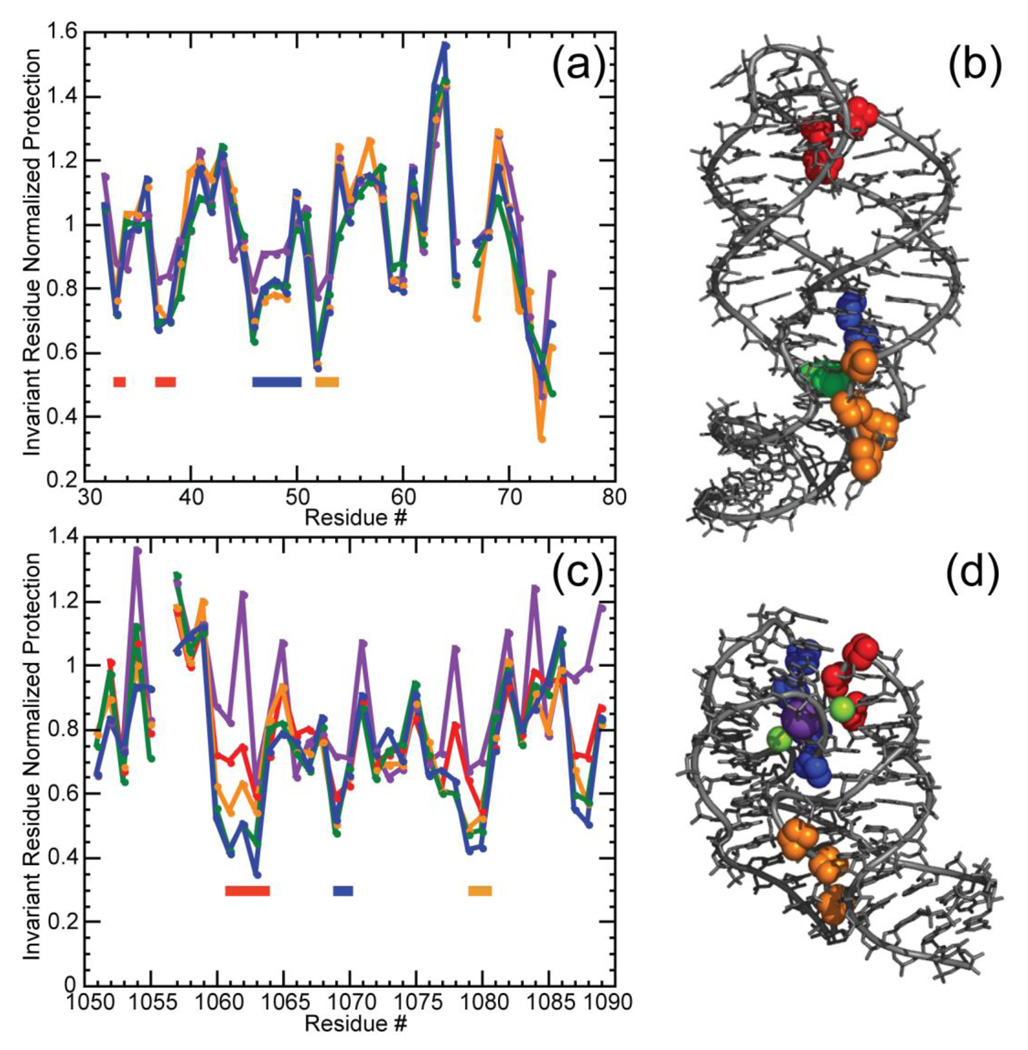
Figure 6.
Normalized data for the reactivity of the A-riboswitch (a, b) and 58mer rRNA fragment (c, d) towards hydroxyl radical. Gel band intensities have been normalized as described (Materials and Methods). (a) Reactivity of the A-riboswitch was assayed in K-MOPS buffer pH 6.8, 50 mm K+ plus no TMAO (purple); 5 m TMAO (yellow); 8 m TMAO (green) or 5 mm MgCl2 (blue). MOPS anion concentrations were 20 mm (no TMAO or MgCl2), 125 mm (5 m TMAO) or 182 mm (8 m TMAO). Regions of increased protection compared to the unfolded conformation are indicated by colored bars corresponding to residues depicted in panel (b). (b) Residues protected from hydroxyl radical displayed on the A-riboswitch crystal structure (1Y26) where residues 33, 37 and 38 are colored in red, 46 to 49 are displayed in blue, and 52 and 53 are shown in yellow. The adenine ligand is depicted in green. (c) Reactivity of the 58mer RNA obtained in K-MOPS buffer pH 6.8, 60 mM K+ plus no TMAO (purple); 4 m TMAO (red), 5 m TMAO (yellow), 8m TMAO (green); or 5 mm MgCl2 (blue). MOPS anion concentrations were 20 mm (no TMAO or MgCl2), 100 mm (4 m TMAO) 125 mm (5 m TMAO) or 182 mm (8 m TMAO). Regions of increased protection compared to the unfolded conformation are indicated by colored bars corresponding to residues depicted in panel (d). (d) Representation of residues protected from hydroxyl radical on the 58mer rRNA crystal structure (1HC8) where residues 18 to 21 are colored in red, 35 to 37 are depicted in blue and 45 to 47 are indicated in yellow. Residues 14 in the 58mer and 66 in the A-riboswitch were impossible to quantify accurately and were not plotted. Protection assessments for residues at the 3’end, which correspond nucleotides at the bottom of the gel, were also unreliable.

