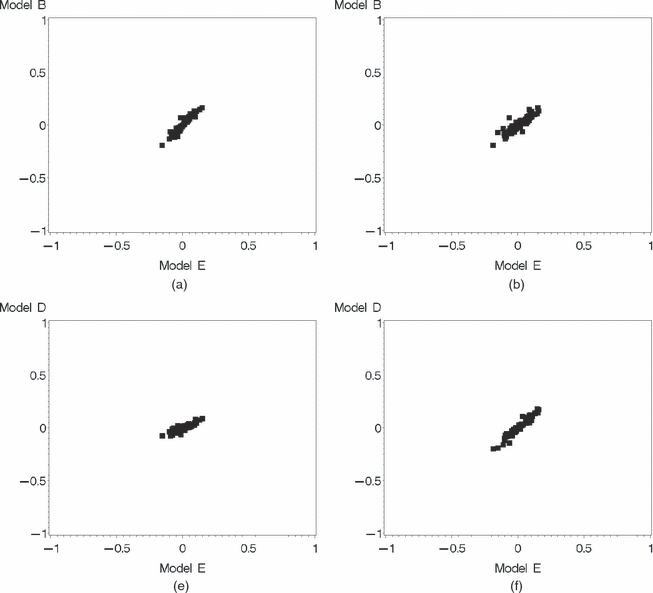
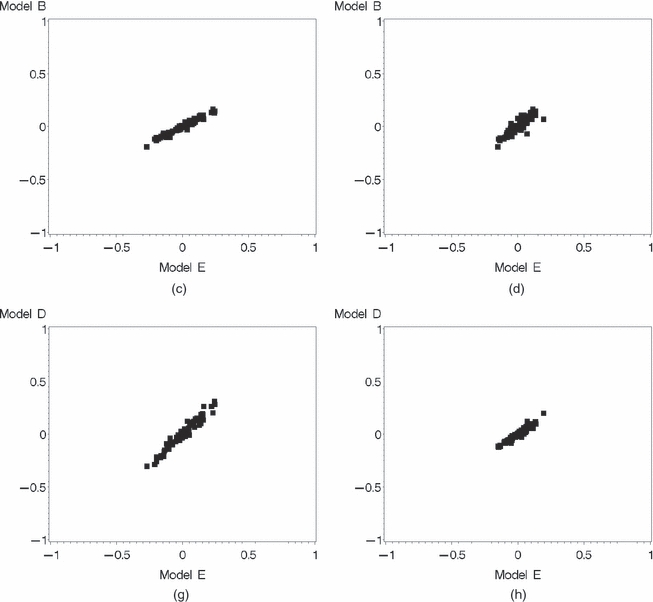
Fig. 2.


Comparison of residuals from (a)–(d) model B (multiple membership) and (e)–(h) model D (cross-classified) with model E (correlated cross-classified) associated with the four different years, ages 60–69 years, in 1990: (a), (e) 1960; (b), (f) 1970; (c), (g) 1980; (d), (h) 1990
