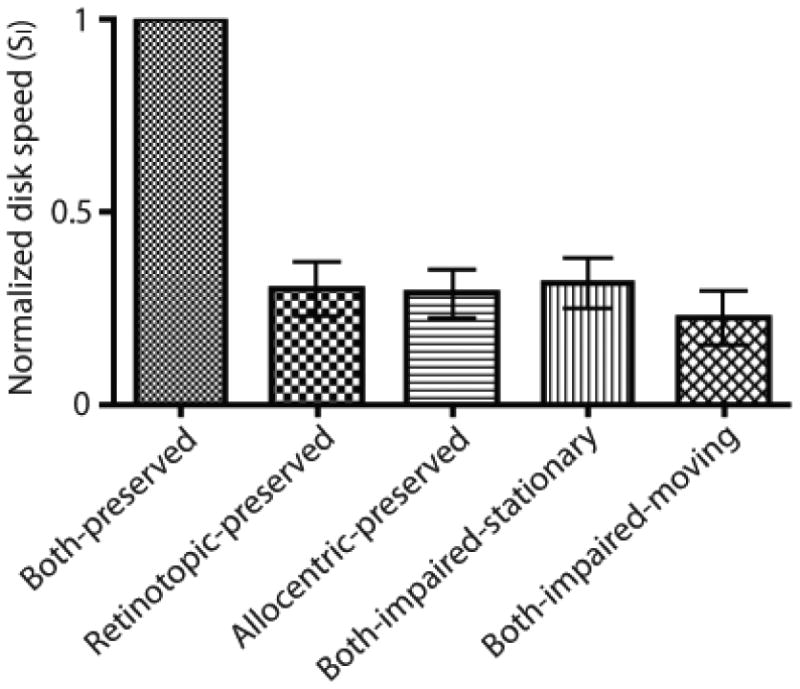
Figure 2.

The graph shows the disk speed relative to the imaginary square (SI) that allowed for all three targets to be tracked correctly on 75% of the trials. To make the data for different observers comparable, for each observer the speeds for the five conditions was divided by the speed in the both-preserved condition. Error bars represent one standard error of the mean.
