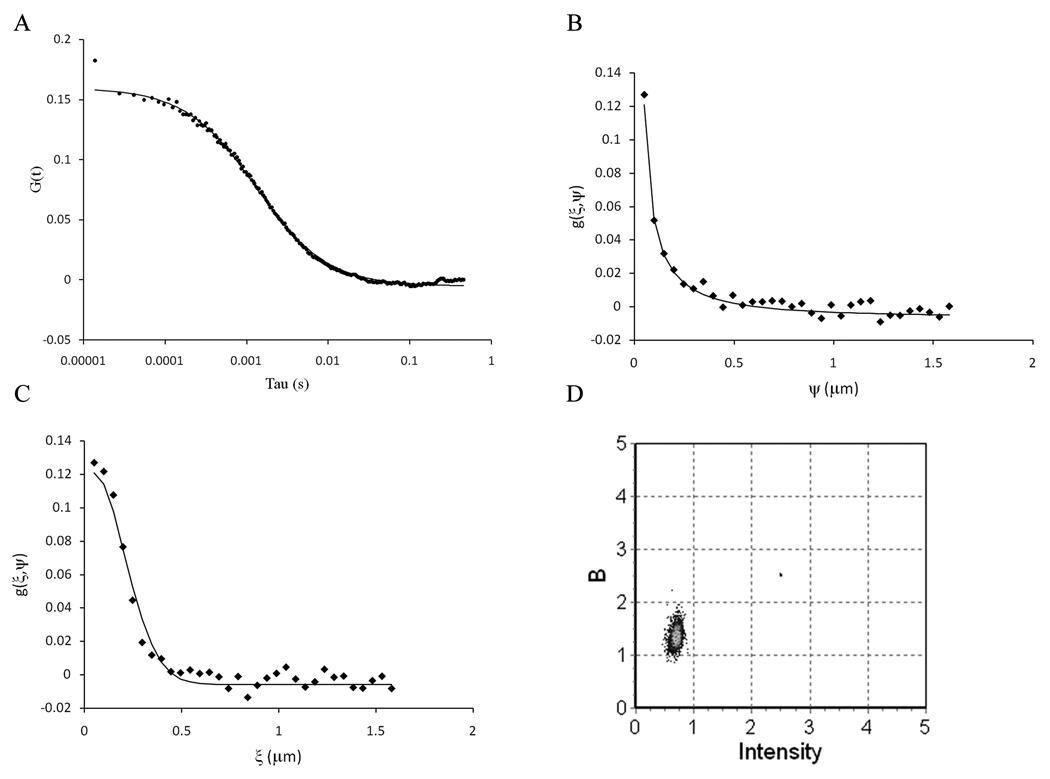
Figure 13.
(a) Analysis of the same GUV using single point FCS (a), RICS (b and c) and Number & Brightness (d) using a pixel dwell time of 13.92 µs, a gain of 8.4 and an offset of 125. (a) Autocorrelation function obtained from the top of the GUV. The solid lines are the fit of the data. (b) Vertical profile of the spatial autocorrelation function. (c) Horizontal profile of the autocorrelation function. The images were acquired using 64 × 64 pixels, with a pixel size of 49.4 nm. (d) Plot of the apparent brightness versus intensity for the same image analyzed by RICS.

