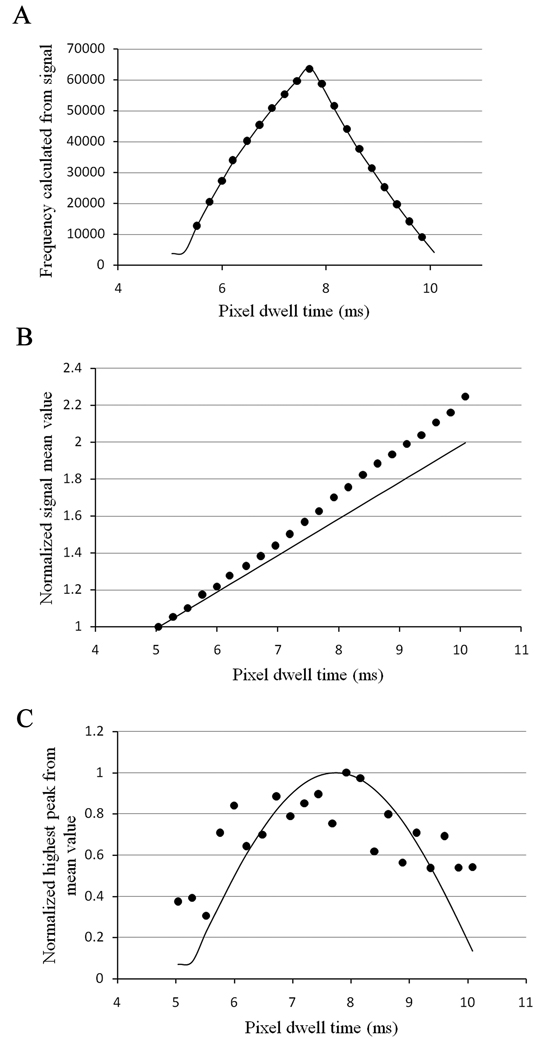
Figure 2.
(a) Frequency in the dark current of the detector. The lines are the simulation for different integration time of a 194.2 KHz signal. The dots are the frequencies calculated from the dark current. (b) Normalized mean value of the dark current (offset). (C) Amplitude variation of the signal around the mean value.

