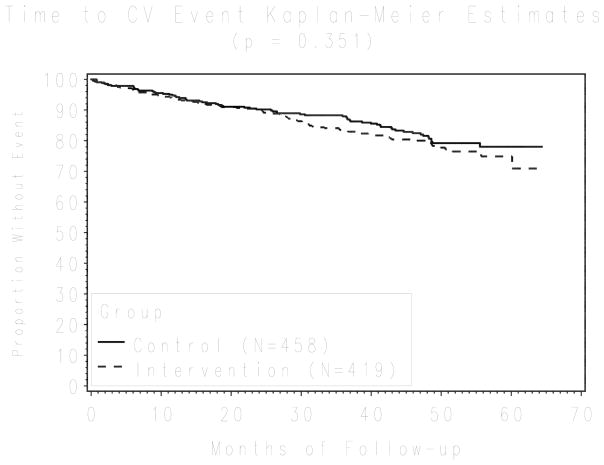
Figure 3.
Kaplan-Meier survival curve for cardiovascular end-points comparing the intervention and the control groups (log-rank test, P = 0.351). The plot shows unadjusted results. Survival results after adjusting, using a multivariable survival Cox model accounting for physician cluster effects, for diastolic blood pressure, age, gender, self-reported measures of adherence, and cardiovascular risk profile, were not statistically significant either (HR 0.97; 95% CI 0.67, 1.39)

