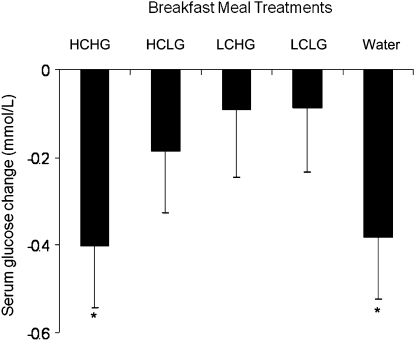
FIGURE 3.
Changes in the serum glucose concentrations of adults between 0 and 300 min after ingestion of 5 test breakfast meals differing in amount and type of carbohydrate (Study 1). Values represent the mean − SEM, n = 9. *Concentrations changed over time, P ≤ 0.01. The conditions did not differ from one another, P > 0.05.

