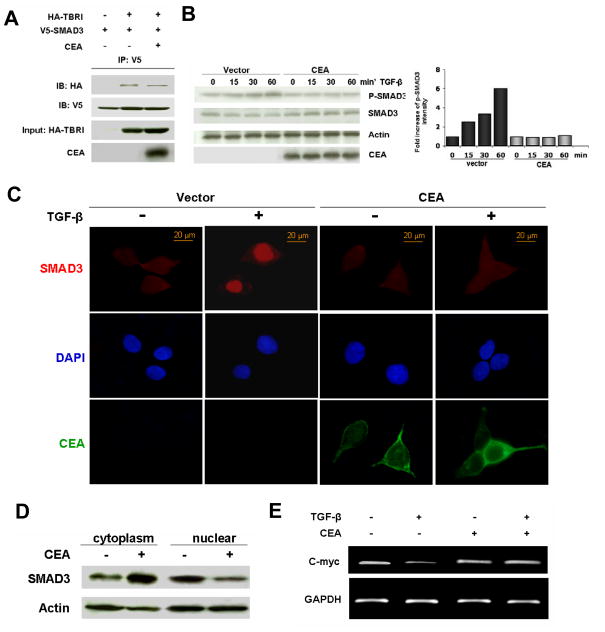
Figure 2. Inhibition of TGF-β signaling by CEA.
A) 293T cells were co-transfected with HA-TBRI, V5- Smad3 and CEA as indicated. 24 h after transfection, cells were treated with TGF-β (100 pM) for 1 h. Coimmunoprecipitation was carried out to evaluate the association of TBRI with Smad3. B) 293T cells were transfected with CEA or vector plasmid for 24 h, and then stimulated with TGF-β (100 pM) for different time periods as indicated. Cells were harvested and p- Smad3 and Smad3 protein levels were evaluated by Western blotting. Histogram shows the fold increase of p- Smad3 intensity compared to that at the time point 0. C) 293T cells were transfected as in B, then stimulated with TGF-β (100 pM) for I h. Cells were then fixed and stained for Smad3 and CEA. Counterstain, DAPI). D) Cells were transfected and stimulated with TGF-β (100 pM) for I h. Cells were lysed, and cytoplasmic and nuclear fractions were separated. Smad3 levels in different fractions were evaluated by immunoblotting. Actin served as loading control. E) 293T cells were treated as in C. c-myc mRNA levels were assessed by RT-PCR. GAPDH served as loading control.

