Figure 8.
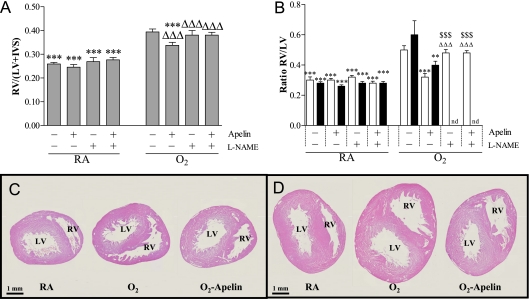
Right ventricular hypertrophy depicted as (A) the weight ratio RV/(LV+IVS) at Day 10 after early concurrent treatment (n = 10, shaded bars) and (B) as RV/LV wall thickness ratio after late treatment and recovery (n = 8) on Days 9 (open bars) and 18 (solid bars) in room air–exposed control pups (RA) and age-matched O2-exposed control pups (O2) daily injected with either saline, apelin, Nω-nitro-l-arginine methyl ester (l-NAME), or a combination of apelin and l-NAME. Data are expressed as mean ± SEM. Cardiac characteristics are presented in Table E3. **P < 0.01, ***P < 0.001 versus age-matched O2-exposed control pups. ΔΔΔP < 0.001 versus room air–exposed control pups. $$$P < 0.001 versus apelin-treated O2 pups. Paraffin heart sections stained with hematoxylin and eosin after late treatment and recovery on Days 9 (C) and 18 (D) in room air–exposed control pups (RA) and age-matched O2-exposed control pups (O2) daily injected with either saline or apelin. IVS = interventricular septum; LV = left ventricle; nd = not determined; RV = right ventricle.

