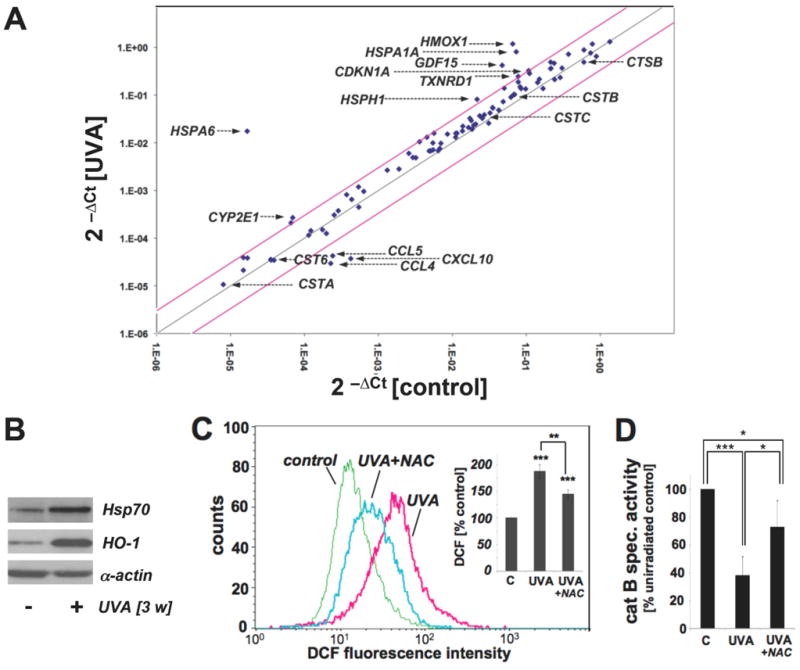
Figure 4. Gene expression changes and oxidative stress in UVA-exposed human skin fibroblasts that display impaired cathepsin B activity.

(A) Differential gene expression in response to chronic UVA exposure (conditions as in Fig. 1; ‘three week’ UVA regimen) or mock treatment was analyzed using the RT2 Human Stress and Toxicity Pathway Finder™ PCR Expression Array. Three independent repeat experiments were analyzed using the two-sided Student's t test as summarized in table 1. Changes in cycle threshold (Ct) for genes of interest relative to ACTB for untreated control (x-axis) versus UVA-exposed (y-axis) cells are displayed as scatter blot. Upper and lower lines represent the cut-off indicating three fold up- or down-regulated expression, respectively. Arrows mark genes of specific interest. (B) Induction of Hsp70 and HO-1 protein expression in UVA-exposed fibroblasts from (A) was determined by Western blot analysis using α-actin detection as a loading control. (C) Modulation of cellular oxidative stress was examined in UVA-exposed cells irradiated (‘one week’ UVA regimen) in the presence or absence of NAC (10 mM) by flow cytometric detection of DCF fluorescence. One representative histogram is shown. Bar graph depicts summarized data of three independent repeats (n=3, mean ± SEM; p<0.05). (D) UVA-induced changes in cathepsin B specific enzymatic activity were assessed in human skin fibroblasts (‘one week’ UVA regimen) irradiated in the presence or absence of NAC (10 mM) using a fluorigenic enzyme substrate as described in Experimental Procedures (n=3, mean ± SEM; p<0.05).
