
Figure 2. Liver cell infiltration.
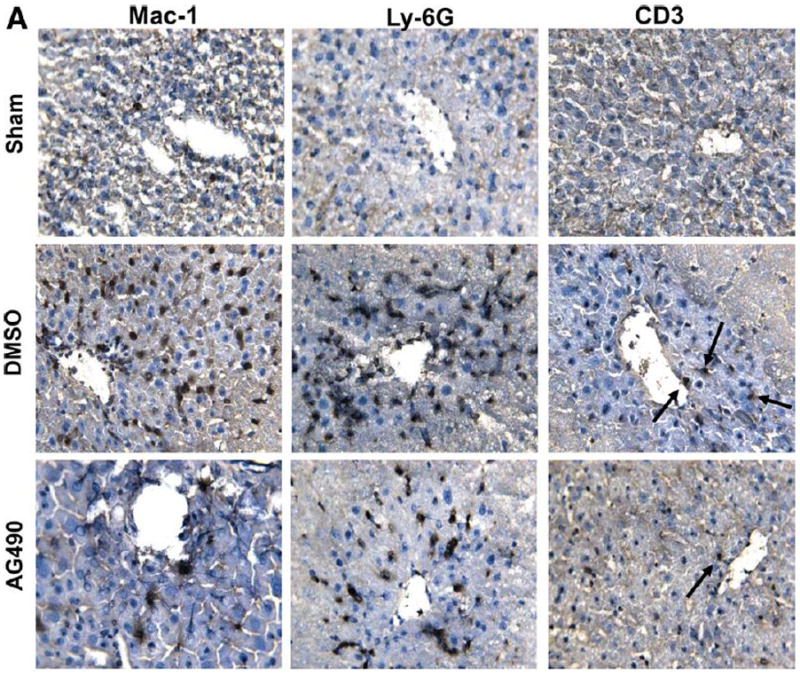

(A) Representative immunoperoxidase staining of macrophages (Mac-1), neutrophils (Ly-6G) and T cells (CD3) in ischemic liver lobes harvested at 6 h of reperfusion after 90 min of warm ischemia. Arrows denote labeled cells. (B) Quantitation of cellular infiltration by immunohistochemistry (*p < 0.01; n=4/group) (x400 magnification). Means and SD are shown.