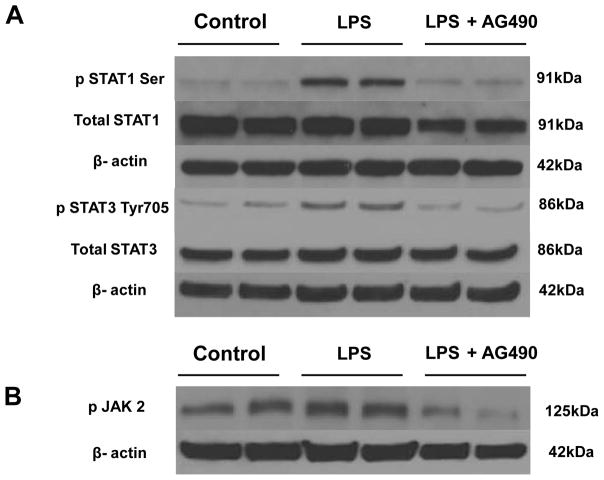
Figure 7. Activation of STAT1, STAT3 and JAK2 in LPS-stimulated hepatoma cells.
(A). Representative Western-blot analysis of phospho- and total STAT1 and phospho- and total STAT3. Within 1 h after treatment with LPS, STAT1 and STAT3 were robustly phosphorylated. Treatment with AG490, 2 h prior to LPS stimulation, significantly decreased both phospho-STAT1 and phospho-STAT3 expression in hepatoma cells (CRL1830) (*p < 0.05, n= 2/group). (B). Representative Western-blot analysis of JAK2 phosphorylation. Within 2 min after treatment with LPS, JAK2 became phosphorylated. Treatment with AG490, 2 h prior to LPS stimulation, significantly decreased phospho-JAK2 expression in hepatoma cells (CRL1830) (*p < 0.05, n= 2/group).

