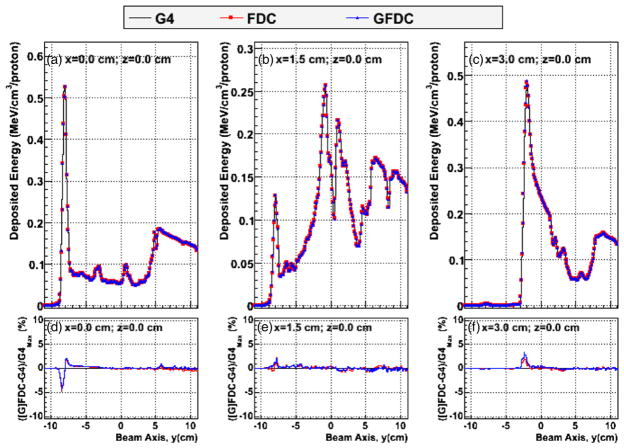
Figure 2.
Deposited energy profiles in voxels along the beam axis, y, for z = 0 and (a) x = 0, (b) x = 1.5 cm and (c) x = 3.0 cm. The y-axis runs from posterior to anterior of the patient. Distributions were calculated with GEANT4 (G4: black line), FDC (red circles) and GFDC (blue triangles). The differences in dose between GEANT4 and FDC (red line) and GFDC (blue line) and GEANT4 divided by the maximum GEANT4 dose are shown in panels (d), (e) and (f) for x = 0, x = 1.5 cm and x = 3.0 cm, respectively.

