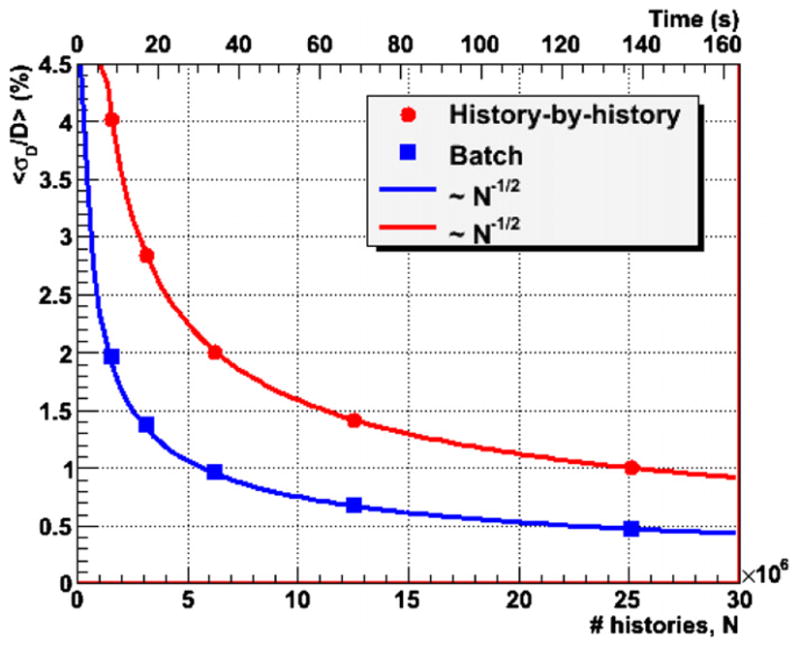
Figure 5.

The mean statistical uncertainties of GFDC dose distributions calculated with the history-by-history and the batch approaches as a function of the number of proton histories (N) and calculation times. The lines are functions proportional to N−1/2 adjusted to cross the point with the lowest N for each of the methods.
