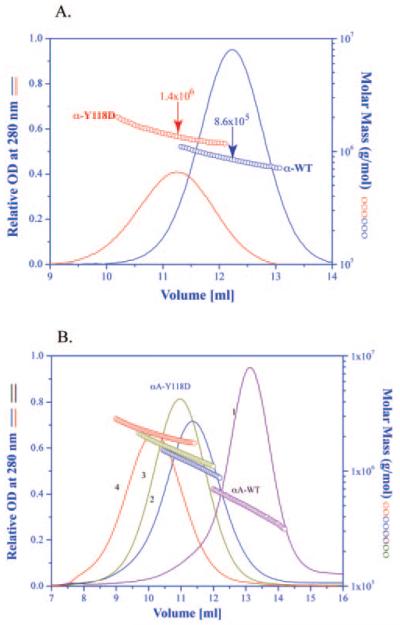
Figure 2.
(A) Elution profile and molar mass distribution of the α-crystallin peak obtained from a wild-type lens, and an αA(Y118D/Y118D) mutant lens shown in Figure 1. The molar mass distribution was obtained (AKTA Basic system; GE Healthcare) using a column (Superose 6 HR 10/30; GE Healthcare) connected in line with an absorption detector, a multi-angle laser light scattering detector and a refractive index detector. (B) Elution profile and molar mass distribution of the αA-Y118D and wild-type αA-crystallin. Curve 1, wild-type αA-crystallin at 25°C; curve 2, recombinant αA-Y118D at 25°C; curve 3, recombinant αA-Y118D after heating for 30 minutes at 37°C and then cooling back to 25°C; curve 4, recombinant αA-Y118D after heating for 30 minutes at 45°C and then cooling back to 25°C. All other conditions are the same as in Figure 1.

