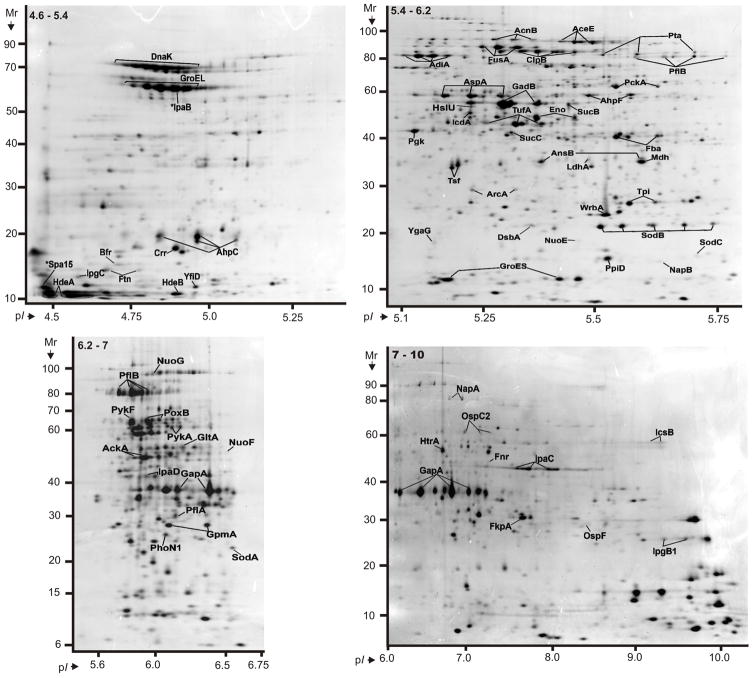
Fig. 3.
Proteins derived from a strain Sd1617 cell lysate and separated in 2D gels representing four pH ranges. Cells were isolated from the large bowel of the infected piglet #1. The IPG strips for the separation according to the proteins’ pI values were 4.5–5.5 (top left), 5–6.2 (top right), 5–8 (bottom left) and 6–10 (bottom right). The denoted pH ranges (top left insert in each gel image) pertain to protein pre-focusing via in-solution IEF. Experimental conditions for 2D gel electrophoresis and staining are described in the Methods. Many displayed proteins are listed in Table 1 with further descriptions.

