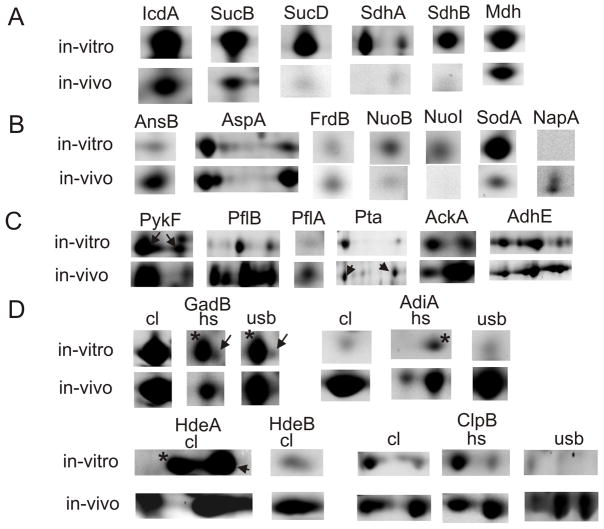
Fig. 5.
Proteins altered in abundance comparing in vitro and in vivo 2D spot profiles. A: tricarboxylic acid cycle enzymes; B: enzymes or enzyme subunits with known or putative functions in anaerobic/ microaerobic respiration: fumarate as electron acceptor (AnsB, AspA and FrdB), NADH as electron donor (NuoB and NuoI), nitrate as electron acceptor (NapA); C: mixed acid fermentation enzymes; D: acid stress response proteins: amino acid decarboxylases (GadB and AdiA), protein disaggregation chaperones (HdeA, HdeB and ClpB); in row D, the comparison of spot quantities is shown for two or three fractions (cl, cell lysate; hs, hs-MBR fraction; usb, usb-MBR fraction). ▶ indicates a correctly matched spot, if a neighboring spot (*) represented a different protein. N-fold abundance differences are reported in Table 1.

