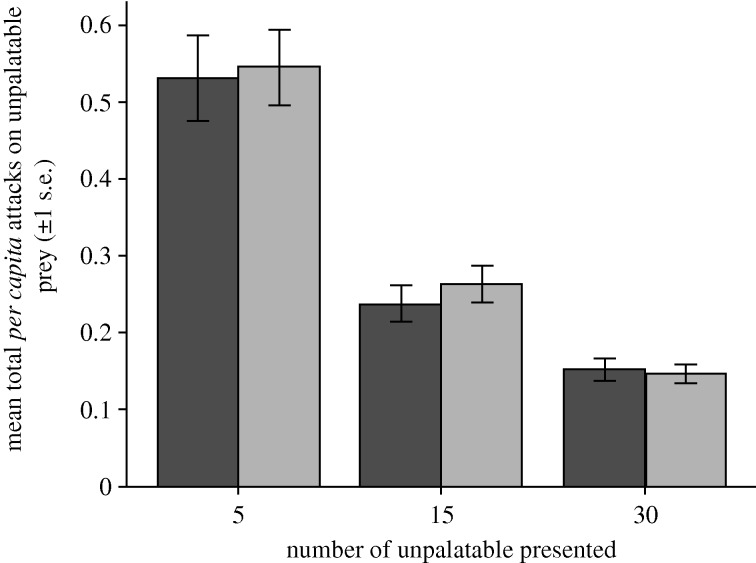
Figure 2.
The mean total per capita attack rate (+s.e.m.) on unpalatable prey, calculated by dividing the total number of unpalatable prey attacked across all eight trials, by the total number presented during the eight trials. Dark grey bars, 20 edible alternative prey; light grey bars, 30 edible prey.

