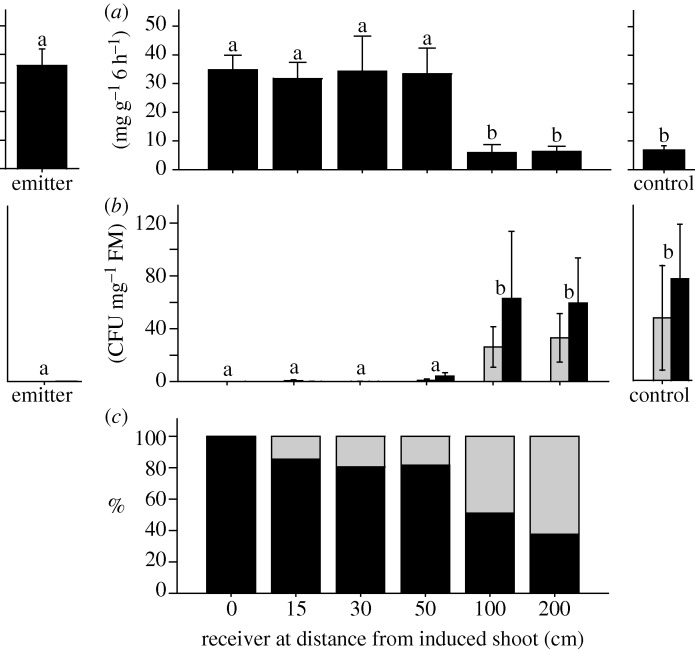
Figure 2.
Distances in plant–plant communication. (a) EFN secretion was quantified as a measure of indirect resistance to herbivores in milligram soluble solids secreted per gram leaf fresh mass over 6 h. (b) Numbers of CFUs were determined in leaves that had been challenged with Pseudomonas syringae as a measure of resistance to pathogens and are expressed as CFU per mg leaf fresh mass. Bars represent means ±s.e., means marked with different letters were significantly different (p < 0.05 according to LSD post hoc test). Grey bar, day 2; black bar, day 4. (c) Proportions of own (black bar) versus foreign (grey bar) leaves in circles with a radius of the same distances at which receivers had been positioned. 0 cm, leaf in the centre of the circles.

