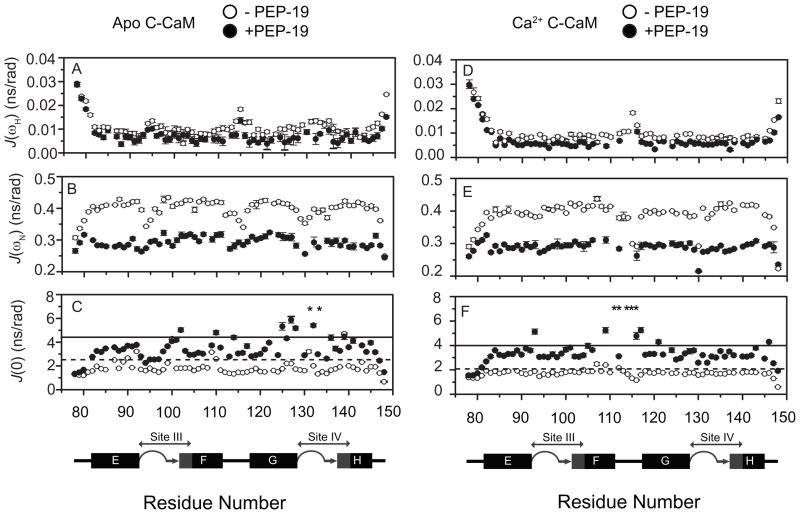
Figure 6. Reduced spectral density mapping for apo C-CaM, apo C-CaM/PEP-19, Ca2+-bound C-CaM and Ca2+-bound C-CaM/PEP-19.
Reduced spectral density parameters were calculated using Eq. (3) to Eq. (7). J(ωH), J(ωN), and J(0) are shown for apo- and Ca2+-C-CaM in the absence (open circles) and presence (closed circles) of PEP-19. The mean +1.0 SD of J(0) for apo and Ca2+-bound C-CaM in the absence and presence of PEP-19 is indicated by dash and solid line, respectively. Asterisks denote resonances with significant line-broadening in the presence of PEP-19.

