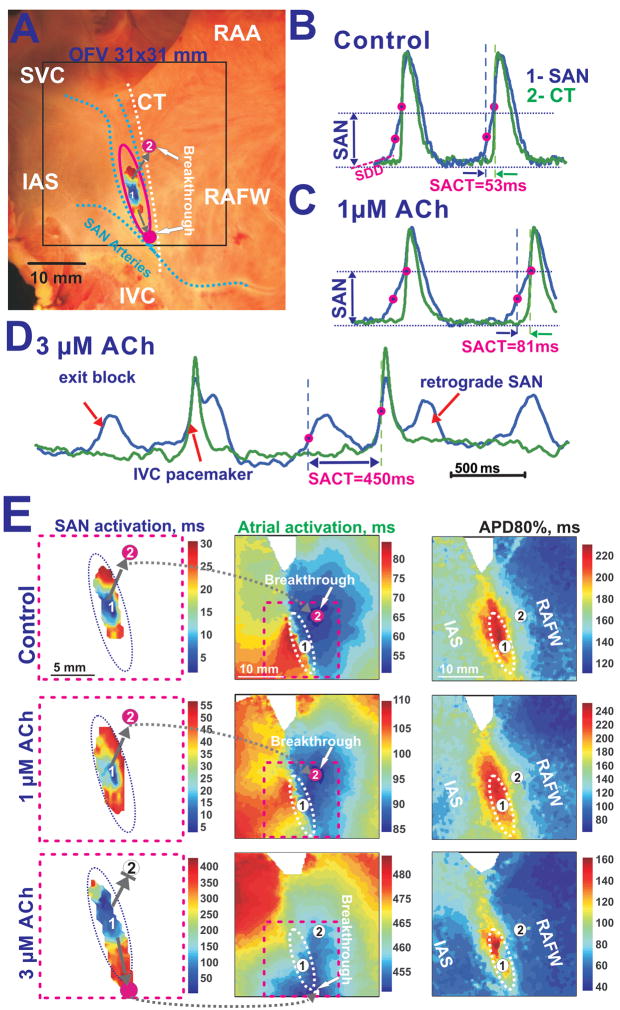
Figure 1. ACh effects on the canine SAN preparation during slowing sinus rhythm.
Panel A – Image of the canine preparation that depicts the location of the SAN (pink oval), SAN activation, optical field of view (OFV) (black box), and coronary arteries (dotted blue lines). In all panels, the beginning of the atrial activation sequence (breakthrough) is signified by pink circles. Grey arrows indicate sinoatrial exit pathways (SACPs).
Panels B, C and D - OAPs in control conditions and during perfusion with 1 μM and 3 μM Ach, respectively. The SAN OAP (blue #1) was chosen from the center of the SAN (1). The atrial OAP (green #2) represents the earliest atrial excitation site in the CT. Optical recordings from the SAN exhibit the slow diastolic depolarization (SDD), slowly rising upstroke of the SAN (SAN component) and the rapidly rising upstroke of the atrial myocardium (atrial component).
Panel E– Separated SAN and atrial activation maps as well as action potential duration (APD80%) maps during control and during perfusion with 1 μM and 3 μM ACh. The unlabeled, dotted ovals show the approximate border of the SAN region. The pink dotted squares show enlarged views of the SAN activation maps.

