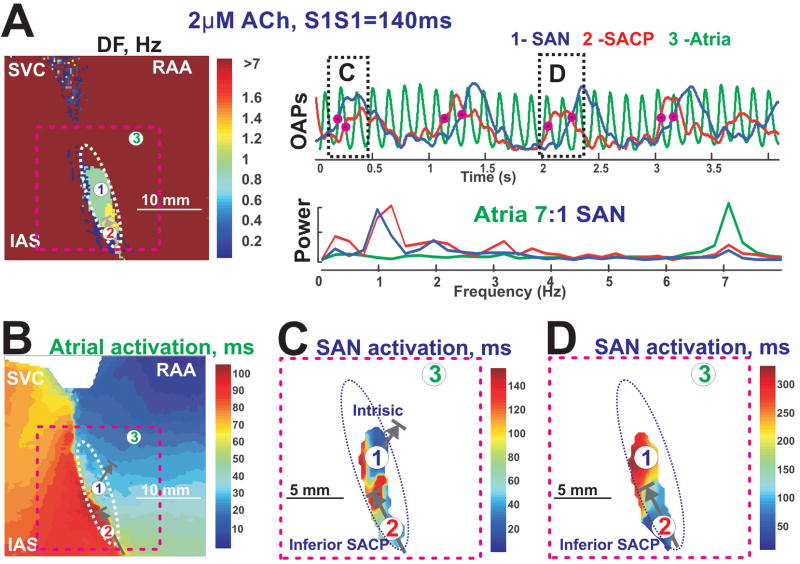
Figure 4. SAN activation during fast atrial pacing and 2 μM ACh.
Panel A - A dominant Frequency map of epicardial OAPs recorded during atrial pacing at a CL of 140 ms with 2 μM Ach along with OAPs and their frequency power spectrums selected from the SAN center (blue #1), inferior SAN (red #2) and right atrial free wall ( green #3). Arrows in the color maps show functional SACPs during pacing.
Panel B - Atrial activation map.
Panel C and D – enlarged views of SAN activations corresponding to the OAPs shown in Panel A, indicated by pink dashed lines.

